Chart of the Week
Mag 7 vs. SPY and Russell 1000 Growth vs. Value
Strip the index down to its load-bearing walls and you find seven of them. Our chart of the week overlays two relationships we have tracked all year, the Mag 7 against the S&P 500 and Russell 1000 Growth against Russell 1000 Value, both indexed back to April 2025, and the divergence between them has become the defining feature of this market. The two lines traveled together through last October which was the date our work flagged as the peak in growth versus value. Since then, they have gone separate ways entirely, with growth versus value grinding down a year-long downtrend to the point where it has now round-tripped the entire move, while the Mag 7 has climbed all the way back to within reach of that October high. The average growth stock has been losing to value for a year.
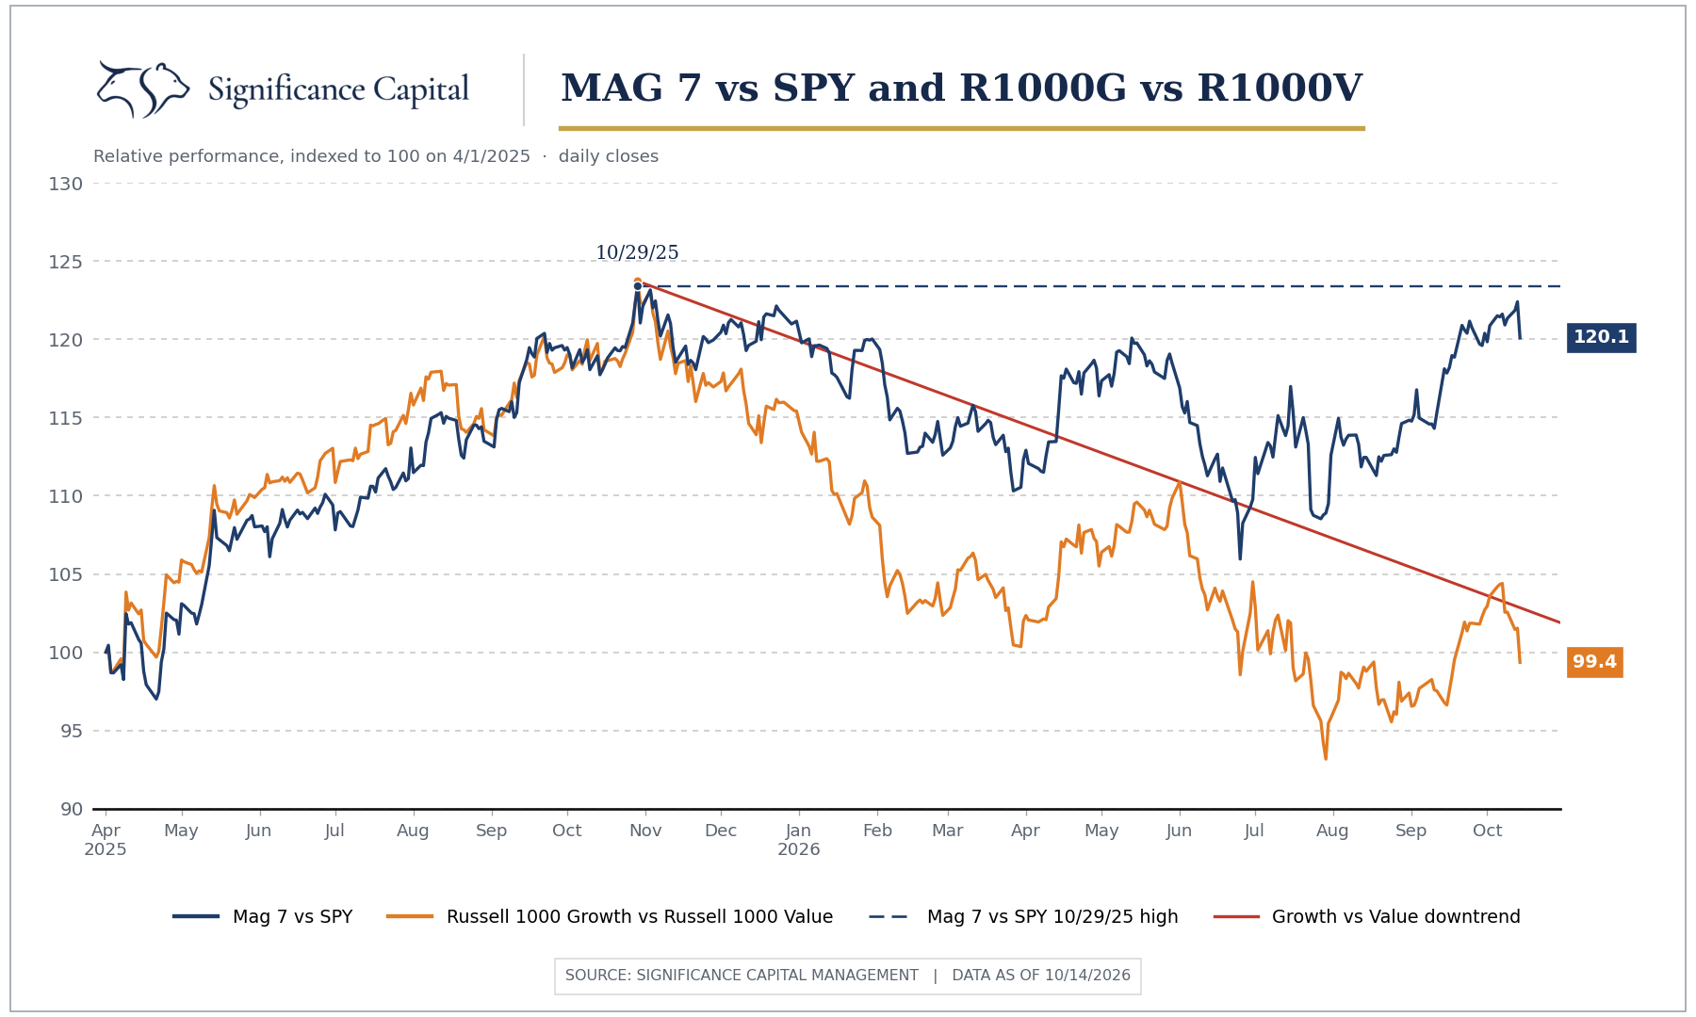
That makes the Mag 7 the group to watch from here, and it's worth being clear-eyed about the consensus view, which is that any trouble in the AI complex actually helps these names, since they are the liquid, cash-rich, diversified way to stay in the trade. We are not so sure. The hyperscalers are no longer bystanders to the riskier corners of the build-out, they are counterparties to it, woven into the neocloud ecosystem through purchase commitments, vendor relationships, and off-balance sheet financing structures that don't show up cleanly in anyone's debt ratios. If stress emerges there, we think it's at least as likely that the tech complex and the broader market come down together as it is that the Mag 7 catches the safety bid. And on a longer horizon, a new generation of AI native competitors is probing exactly the moats that justify these multiples, which means the safety proxy argument rests on a fortress that is actively under siege.
None of this is a prediction that the group cracks. The chart shows a relationship testing its old high, not breaking down, and if the Mag 7 pushes through that level while growth versus value stabilizes, the bull case gets simpler, not harder. But when one trade is holding up the whole index, the right posture is to watch that trade like it's your job, because for the next while, it is.