Chart of the Week
S&P 500 After Midterm Elections
The Brewers are World Series champions. Ryan predicted Brewers in six and they went and won it in five, Milwaukee's first title since 1957 and the first in Brewers franchise history. He ran Friday's session from the office while the parade crowds built outside his window on Wisconsin Avenue, his family staked out on the rail below, and he wore his late Grandpa Bruce's hat for the occasion. That hat went to a lot of Packer games over the years and almost no Brewer games, because the Brewers never used to play in October. They do now. In a series that keeps coming back to significance, a parade morning with three generations on the same block is hard to top.
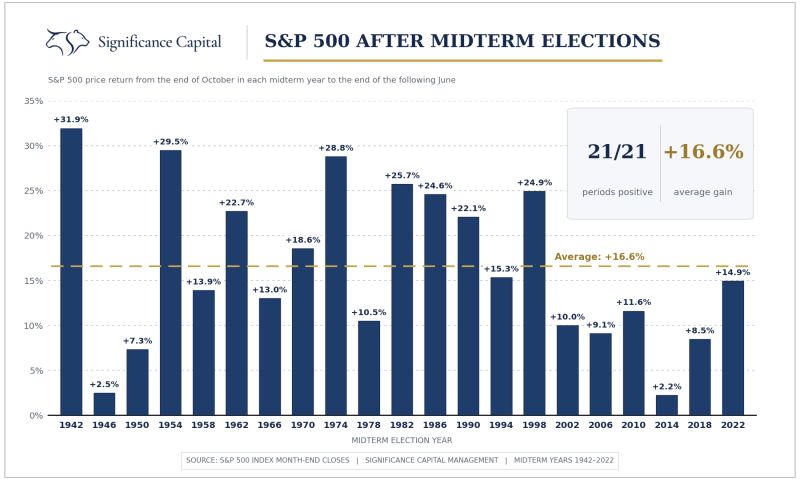
Which brings us to the election on the calendar this week, and our chart of the week, titled “Exit Polls Say Higher.” It shows the S&P 500 from the end of October in every midterm year to the end of the following June, going back to 1942. The record is 21 for 21, every single window positive, with an average gain of 16.6%. No candidate has ever polled like that. We enter that window this week with sentiment stretched and positioning washed out in parts of the market. The seasonal setup is the strongest argument the bulls have right now.
Now for the fine print, because a perfect record deserves skeptical reading. Every instance since 2002 came in below that 16.6% average, so the edge has been shrinking. And the 2018 window, the last midterm under similar conditions of rising rates and a nervous Fed, finished positive only after a nearly 20% peak-to-trough drawdown that started in October. The destination has been reliable, but the ride has not. We respect the seasonality without leaning on it and our risk models will keep dictating how we're positioned. The exit polls say higher by June. They just don't promise you'll enjoy November.