Chart of the Week
MTUM – iShares MSCI USA Momentum Factor ETF
There's an old saying among technicians, from failed moves come fast moves, and it earned the title of Friday's session. Over the past week the market rallied back to the exact levels where mean reversion began on June 2nd, a date our work has flagged all year as the momentum pivot, and got turned away. Tech backed off the line, semiconductors broke marginally above it and failed, and the most important stock in the market (NVDA) did the same thing.
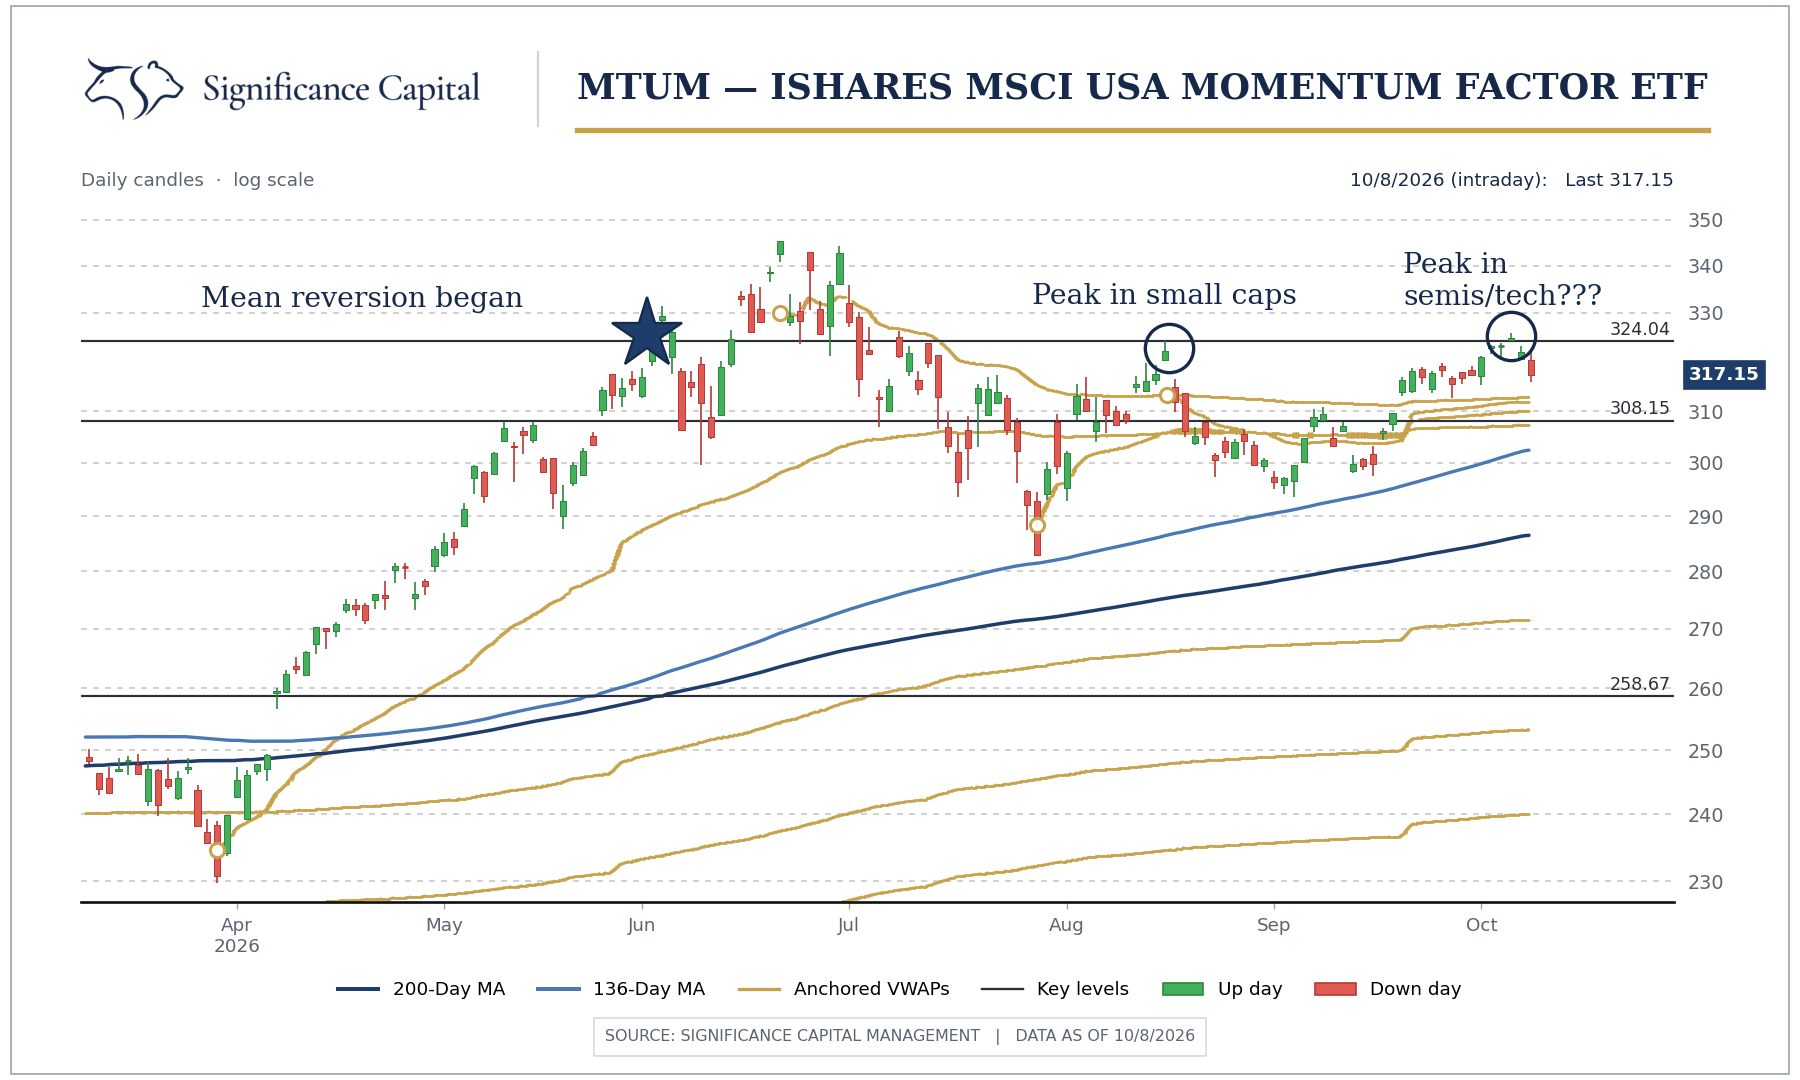
The sequence on the chart is the whole argument. Mean reversion began June 2nd, momentum peaked about three weeks later, the August rally marked the spot where small cap growth quietly went from leader to laggard before correcting more than 10 percent and now a second retracement has been rejected at the same neighborhood. We take rejections like this seriously because of how past momentum unwinds have behaved: in 2015, 2018, 2021, and again last fall, the first break was followed by a retracement that averaged roughly 80 percent of the decline, and then a second leg down that made lower lows and was more painful than the first. This retracement measured 82 percent, and the time sequencing lines up with the last two episodes as well, which is why our posture here is the technician's other old saying, shoot first and ask questions later.
In fairness, the calendar argues the other way, since seasonality into year-end is historically strong, though we'd note the last time a midterm October looked this way, in 2018, the market peaked early in the month and fell straight through Christmas Eve while rates rose, and when seasonality fails, the reversal tends to be violent. So the setup is binary, and honestly we'd welcome either resolution over more of this churn. Reclaim the June 2nd level and the melt-up scenario is alive. Stay rejected below it and a second leg of mean reversion is likely underway.