Chart of the Week
Composite of SCG, LCG and Leading MO Peer
“Hollow at the Highs” was the banner over Friday's session, and it fits a market where the index keeps flirting with records while the foundation underneath looks thinner by the week. Our chart of the week is the cleanest way we know to check on that foundation, a proprietary composite of small cap growth, large cap growth, and our most momentum-sensitive peer group, running back to 2010. Think of it as a dial for risk appetite, one that climbs when investors are aggressively chasing growth, falls when they back away, and, unlike most of what we track, rarely wastes time chopping sideways.
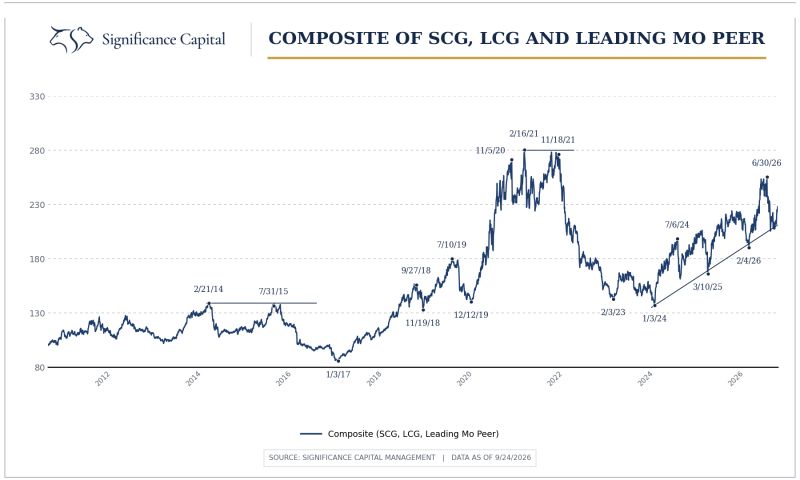
The history is why it earns a spot on the wall. The double top of 2014 and 2015 gave way to one of the worst stretches for growth investors on record, a relative drawdown of more than 30 percent into early 2017, and the February 2021 peak, retested that November, preceded the composite getting cut in half. Now a third historic momentum peak is on the board, marked June 30, with the line pushing back toward it off a higher low, and here is the detail that has our attention: for all the force of the AI thrust, this peak could not reach the 2021 high. That is a divergence years in the making, and we read the current push as likely building another double top in the same neighborhood, one more chapter in a longer-term topping process for growth relative to the broad market.
Two honest caveats before anyone reads this as a bear call. A turn in growth versus value is not the same thing as the end of a bull market, and we are not in the end-of-the-secular-bull camp yet, but if we are wrong and the composite breaks out to new highs, history suggests the risk flips to a tech bubble style blow-off, the kind that runs hot for a few months before it matters. Either way, the dial is doing what it always does, moving in one direction at a time, and we will let it tell us which chapter this is.