Chart of the Week
Russell 2000 Value vs. Russell 2000 Growth
The Brewers are in the World Series for the first time in 44 years, and Ryan was five years old the last time it happened. He spent Friday evening at the ballpark with three generations of family after waiting his entire life for that ticket. We talk a lot about significance in these pages, and a once in a lifetime night at the ballpark with everyone you love is about as clean a definition as we can offer. Some streaks do end, which happens to be the message of our chart of the week too.
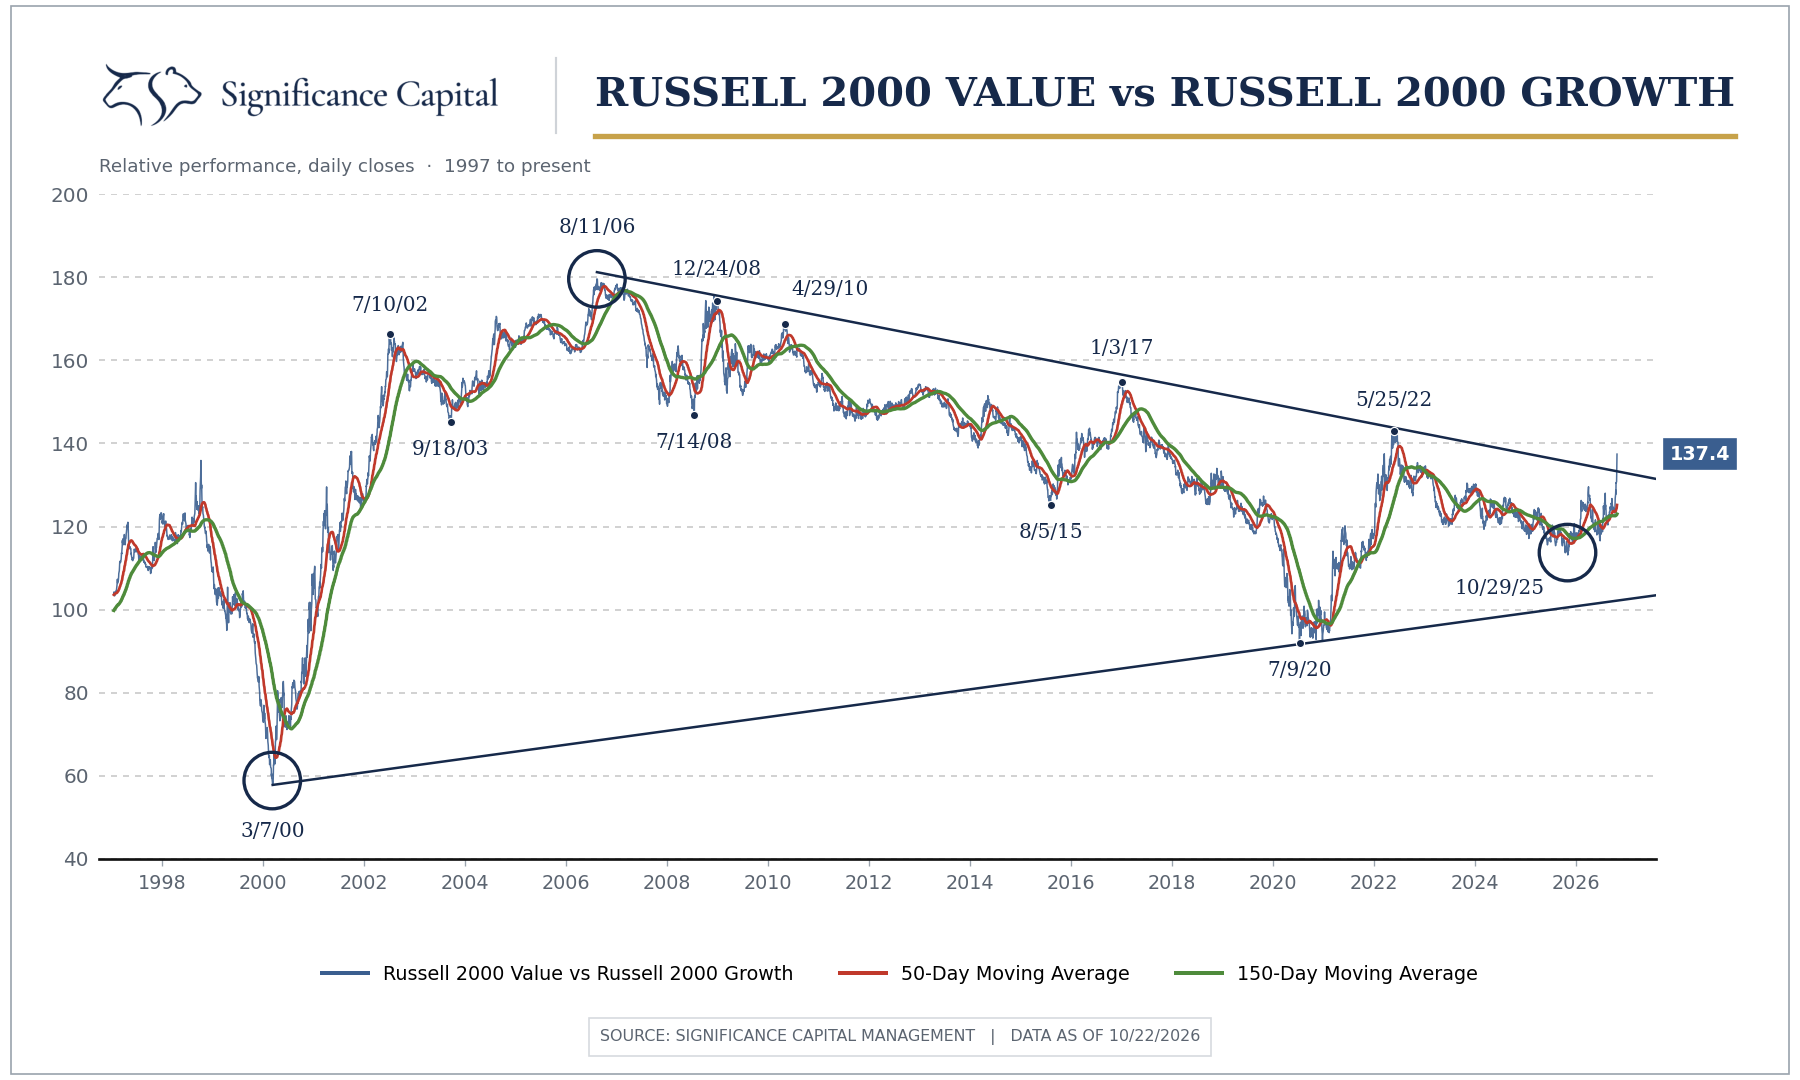
Regular readers will recognize this one, because we showed the same chart in late August. It's the Russell 2000 Value versus Russell 2000 Growth ratio, with circles on the only three dates in nearly thirty years when small and large cap growth versus value turned within days of each other. March 2000 and August 2006 were both secular turning points, and the third circle, October 29th of 2025, is the one this market printed. What's new since August is the main event. The secular trendline that has defined this relationship since 2006 has now broken. That line capped the 2017 breakout in the QQQs and the 2022 lows in the riskiest small cap growth assets, and value just pushed up through it with the kind of straight-up momentum that secular breakouts require. Large cap growth made a new high against value while small caps made a higher low. That's a multi-year divergence, and now we have the first hard evidence of the secular trend itself giving way.
We want to be careful with what this does and does not say. The break is still within a couple percent of the line, so it could reverse, and moves this vertical either fail quickly or build on themselves, with not much in between. Losing the leadership group of a bull market is not immediately bearish either, though it is cause for attention. And the backdrop of elevated rates, sticky inflation and firm commodities all leans the same direction, toward value. Our work suggests this corrective phase in momentum and growth versus value has room to run into December or January. We'll be watching whether this breakout builds or fails as one of the most important tells in markets. Alignment in dates, multi-year divergences, and now a broken trendline. The evidence is stacking up, and we'd rather track it in real time with you than explain it in hindsight.