InsightsWeekly Chart Note

Charting the Course

The Bull, the Bear, and the Barrel: NVIDIA's chart sits at a decision point as the bull case, bear case, and oil outlook compete.

September 14, 20263 min read

Chart of the Week

NVDA: Momentum vs. Mean Reversion

Friday's Charting the Course carried the theme 'The Bull, the Bear, and the Barrel,' and we tried something new to match. With the market this binary, we split the tape: Dillon argued the bull case, Mike argued the bear case, and the barrel of oil got a starring role in both. The honest scorecard is that the evidence remains about even. Compressed tech multiples and historic earnings revisions on one side. Rates, oil, and a momentum unwind on the other.
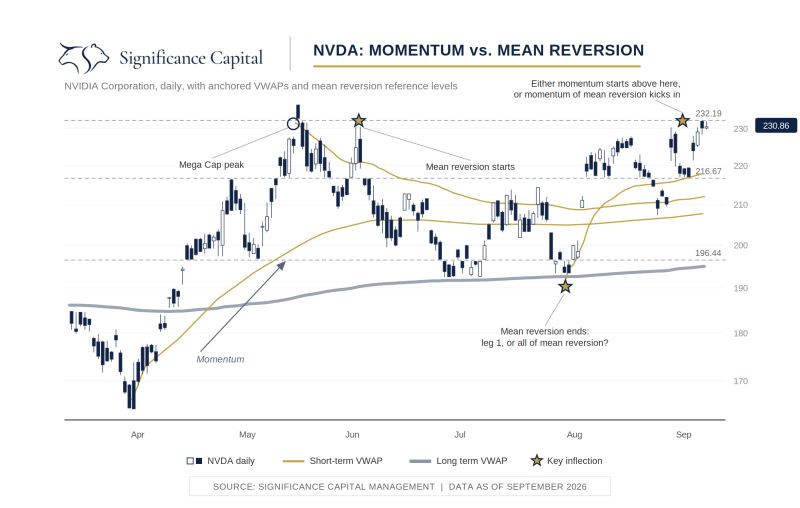
Daily NVIDIA stock chart from spring through September 2026, showing anchored VWAPs, mean reversion reference levels, and key inflection points as the price tests its prior highs.
NVIDIA Corporation, daily, with anchored VWAPs and mean reversion reference levels. Source: Significance Capital Management. Data as of September 2026.

Our chart of the week cuts through all of it. Wars, yields, AI spend, credit default swaps, you can track a hundred things right now, or you can watch NVIDIA. It has been the fundamental engine of this bull market, and the chart sits at a decision point. Since June the stock has been in mean reversion mode, but the past week showed the first early signs of momentum trying to restart. A break above the old highs says the AI-led bull market is resuming. A failure says more chop and possibly momentum of mean reversion taking over. The wildcard is oil, which looks like the head of the snake for inflation. Nvidia's fundamentals can keep improving, but if rates get away from here it will be the defining valuation compressor for stocks. One chart, and it's telling us most of what we need to know.

Weekly Live Review

Join us Fridays at 8:00 AM CT.

A weekly live chart review from Significance Capital, built for investors who want a sharper read on markets without the noise.

Important Information

Technical trading models are mathematically driven based upon historical data and trends of domestic and foreign market trading activity, including various industry and sector trading statistics within such markets. Technical trading models, through mathematical algorithms, attempt to identify when markets are likely to increase or decrease and identify appropriate entry and exit points. The primary risk of technical trading models is that historical trends and past performance cannot predict future trends, and there is no assurance that the mathematical algorithms employed are designed properly, updated with new data, and can accurately predict future market, industry, and sector performance.

For information regarding Significance Capital, its services, fees, conflicts, and other pertinent information, visit the firm's Investment Adviser Public Disclosure page.