Chart of the Week
TLT – 20+ Year Treasury Bond ETF
The second highest volume week in the history of the 20-year Treasury ETF, and it printed on the way down. That's our chart of the week from Friday's session and it matters because volume has a habit of peaking at major inflection points. With yields spiking, bond proxies bludgeoned, and the equal weight S&P down seven straight weeks for the first time since 2022, last week's flood of selling in Treasuries looks less like the start of something and more like the crescendo of it.
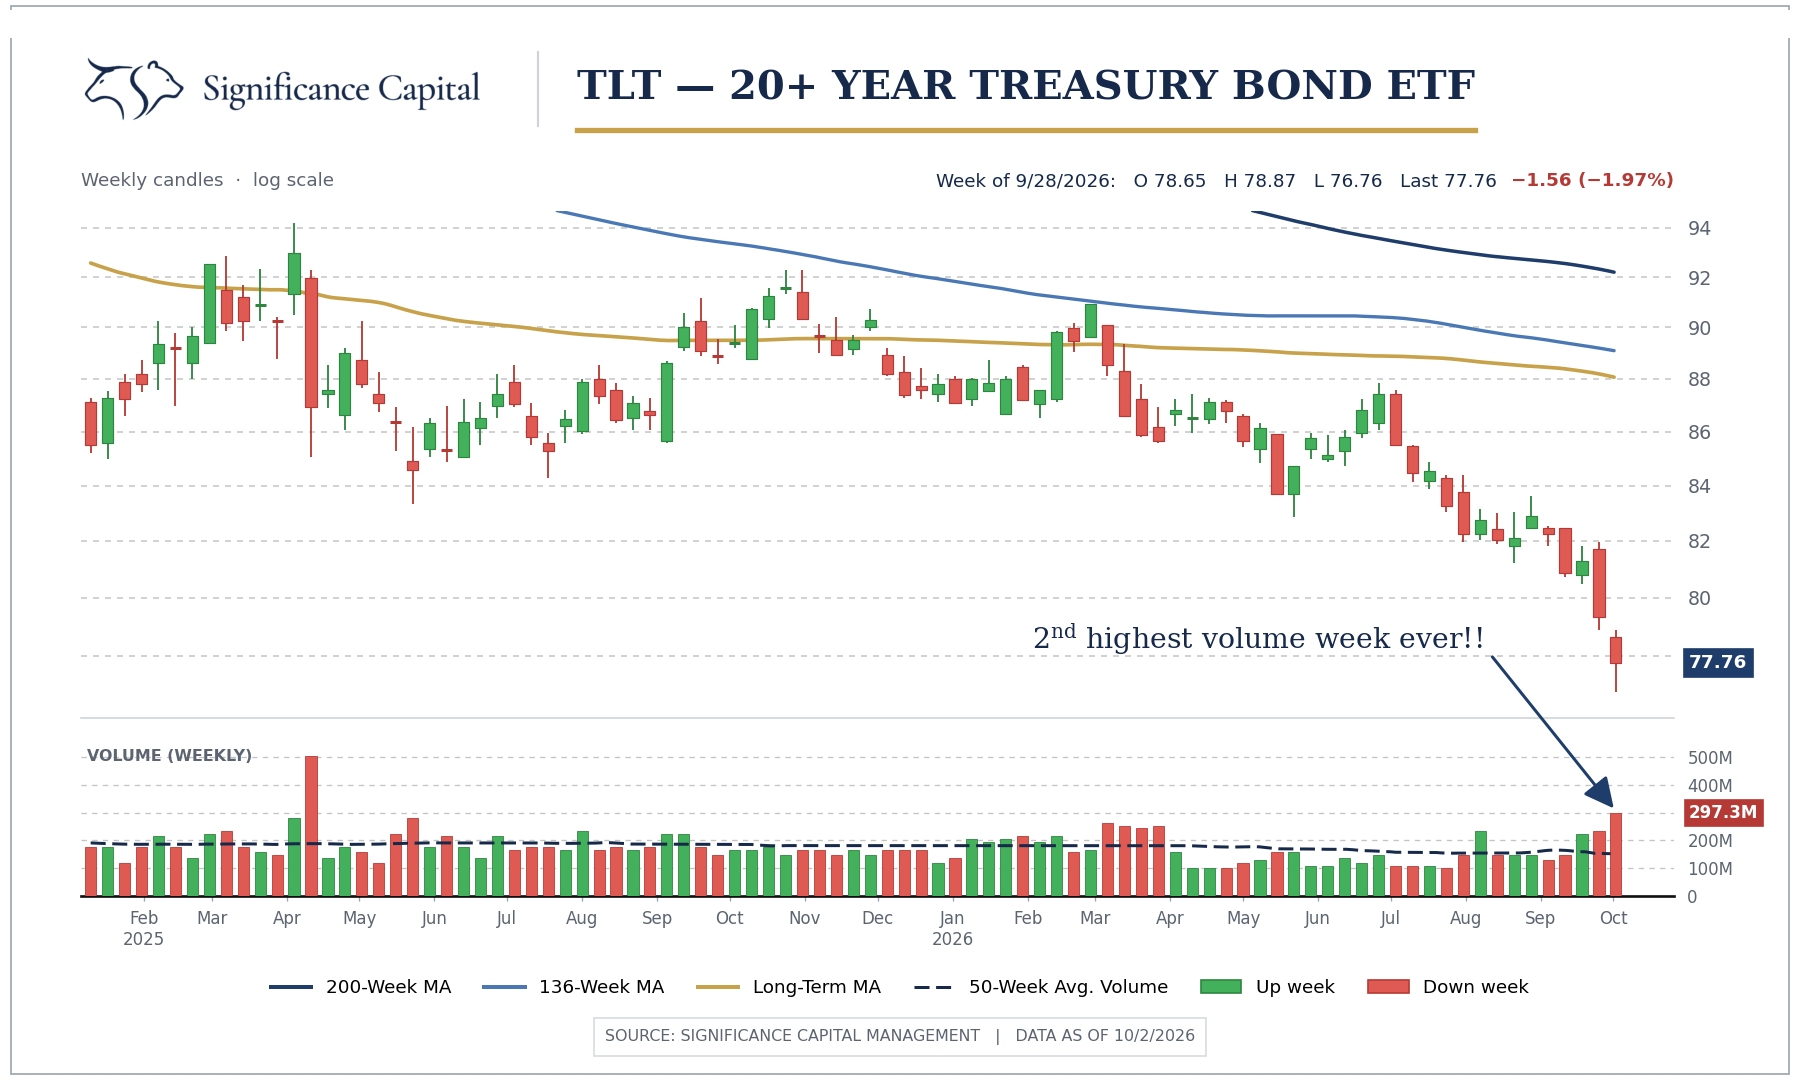
What we'd want to see next is straightforward, and it comes from the playbook of past capitulation weeks: a green week whose buying interest matches or exceeds last week's selling, the classic high-volume reversal that marks a durable low. If that confirmation shows up, we'd have real conviction that a near term peak in yields is in and the knock-on effects would run through everything that's been punished, the bond proxies, the low volatility names, the equal weight index, all of which are sitting on major trend support from prior momentum thrusts.
The backdrop helps the case more than it hurts it. The market has absorbed this yield spike very differently than past inflation scares because earnings growth has been historically strong. A momentum thrust from here could carry six to eight weeks, perhaps through year end. We remain cautious on the longer-term picture, the secular concerns haven't gone anywhere, but near term, the loudest week in bond market history is usually worth listening to.