Insights / Weekly Chart Notes
Charting the Course
Weekly chart-led perspectives from Significance Capital, built to help investors read the market without the noise.
Register for the Weekly Live ReviewLatest Notes
The chart is the story.
Each post pairs an original Significance Capital chart with the market context behind it.
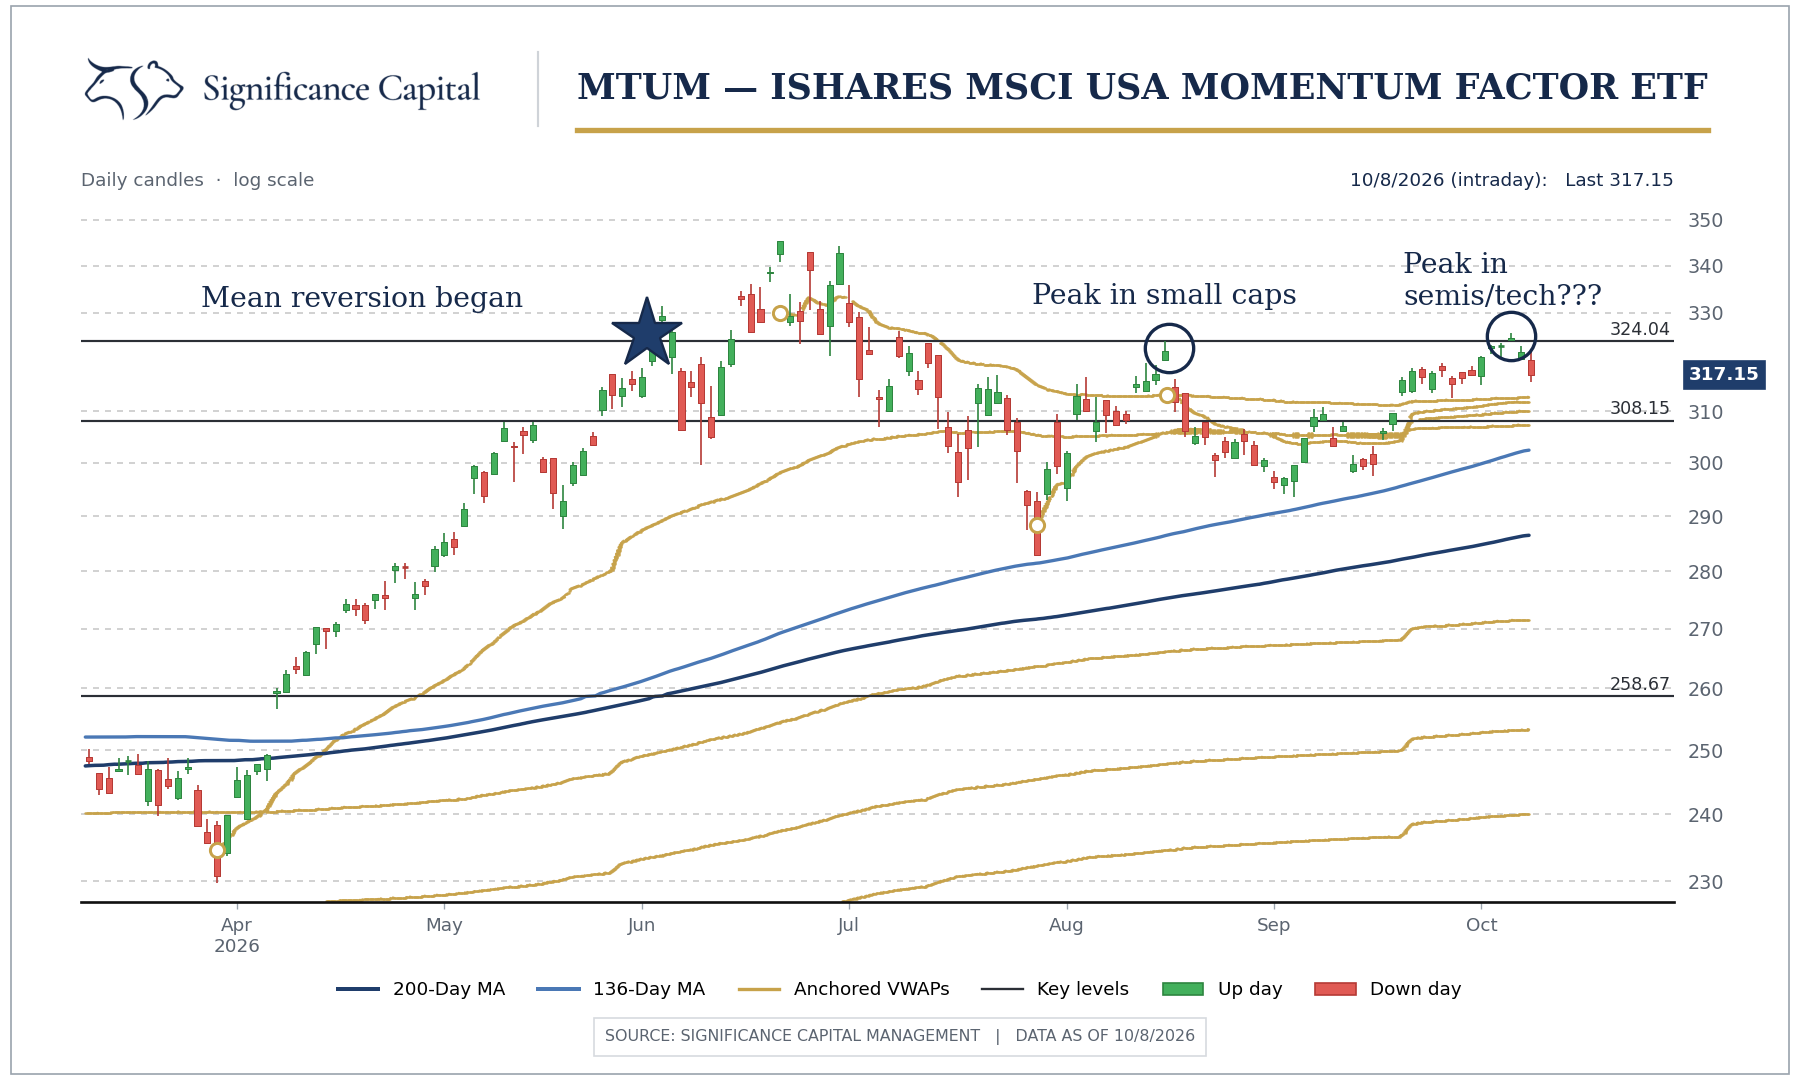
From Failed Moves Come Fast Moves
A rejected rally near the June 2 mean-reversion level puts the focus on whether momentum can recover or a second leg lower is underway.
Read the Note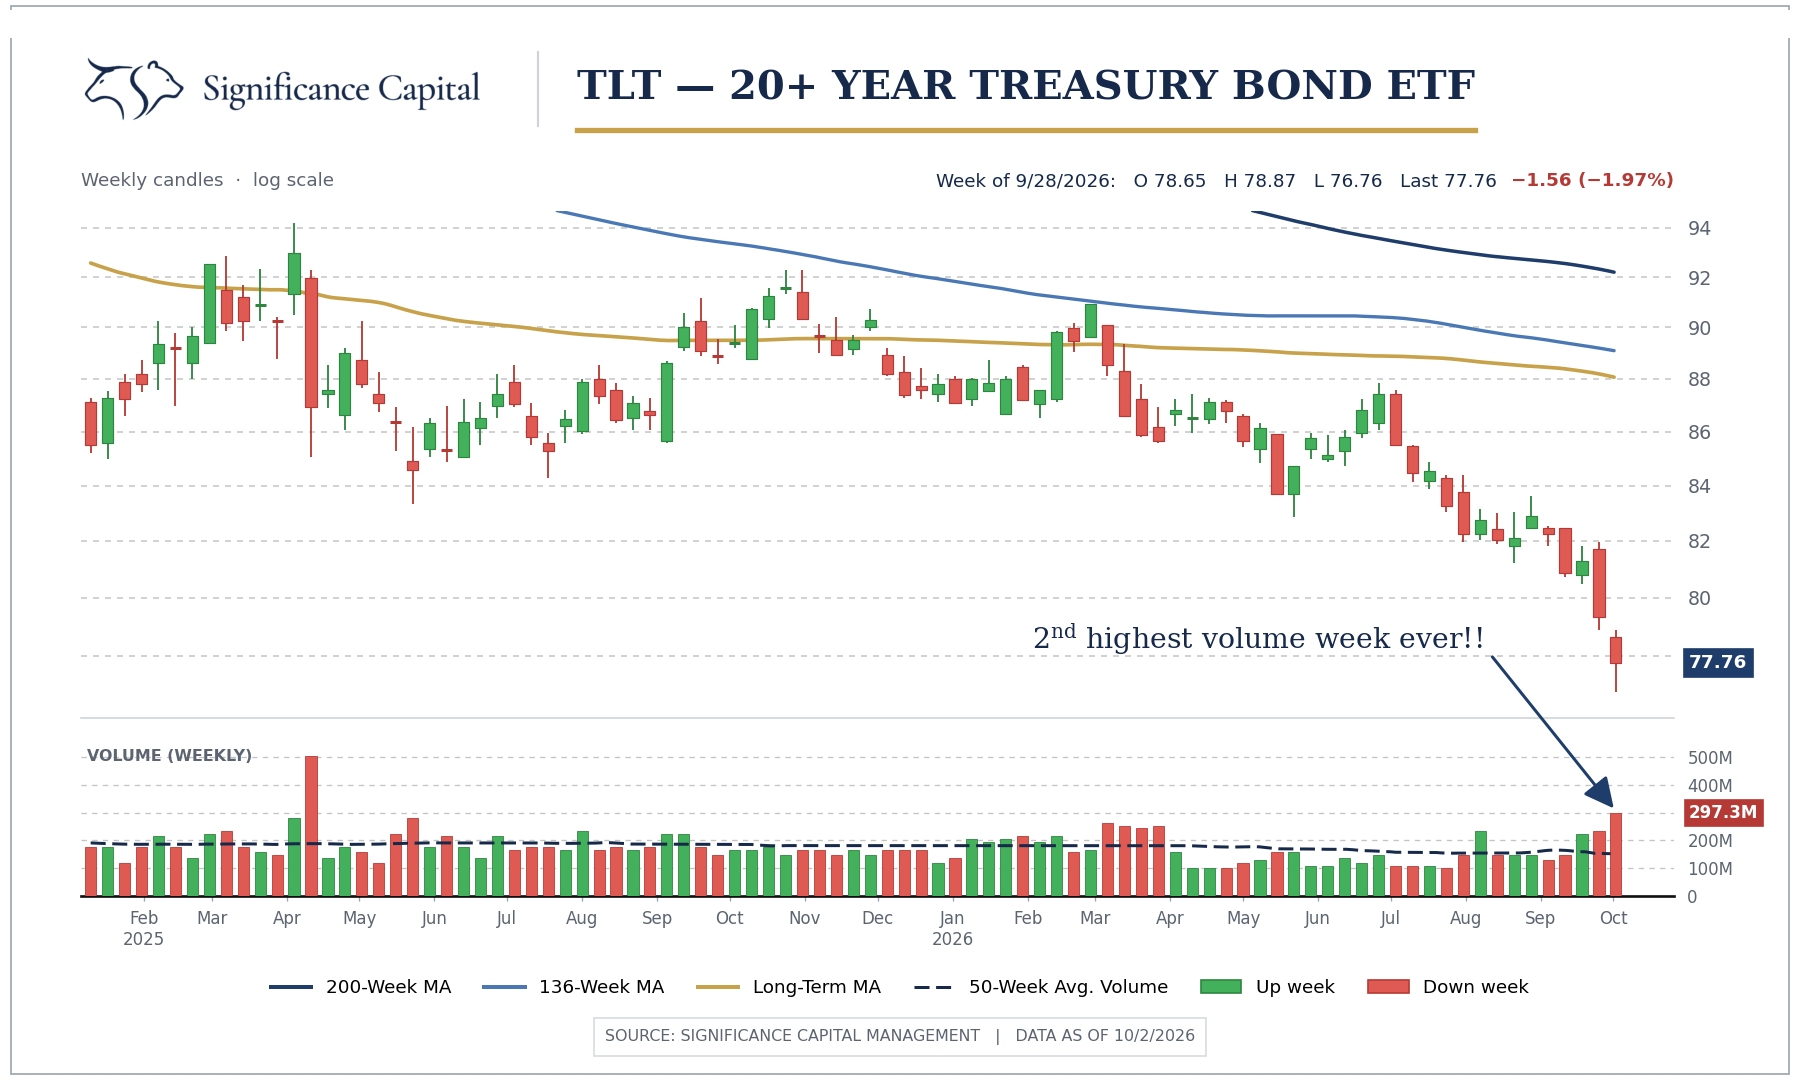
Turn Up the Volume
An unusually heavy week of Treasury ETF selling puts the focus on whether a high-volume reversal can confirm a near-term peak in yields.
Read the Note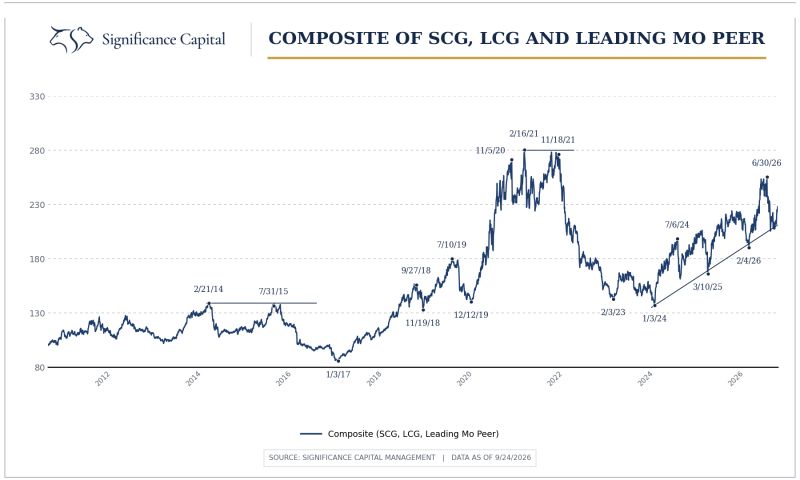
Hollow at the Highs
A growth and momentum composite approaches its June peak below the 2021 high, putting the strength of risk appetite and market leadership in focus.
Read the Note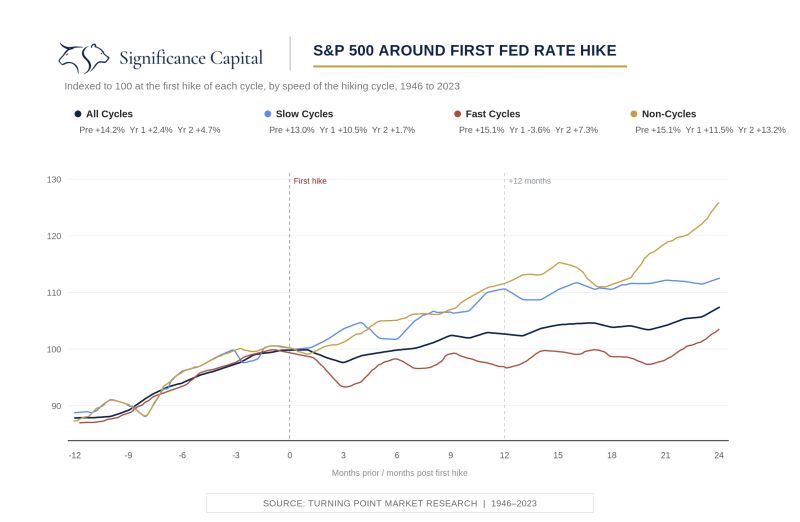
So, the Fed Hiked. Now What?
Historical S&P 500 returns around the first Fed hike highlight why the pace of the hiking cycle matters more than the initial move.
Read the Note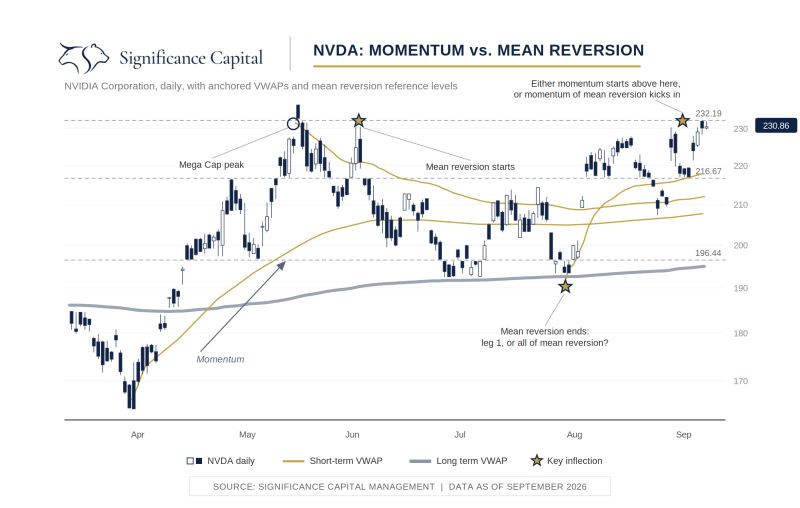
The Bull, the Bear, and the Barrel
NVIDIA sits at a decision point as early signs of momentum return, while oil and interest rates complicate the broader market outlook.
Read the Note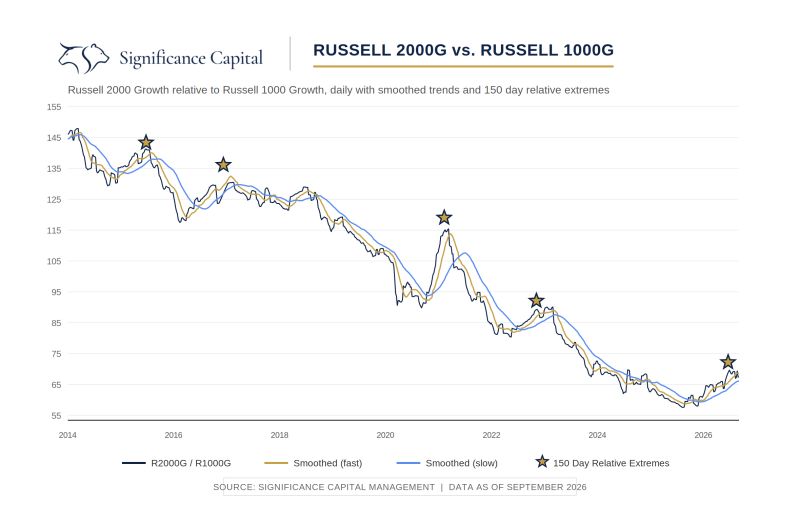
Signal vs. Noise
A fifth 150-day relative extreme in small-cap versus large-cap growth puts the focus on market leadership and what the latest turn may mean for risk appetite.
Read the Note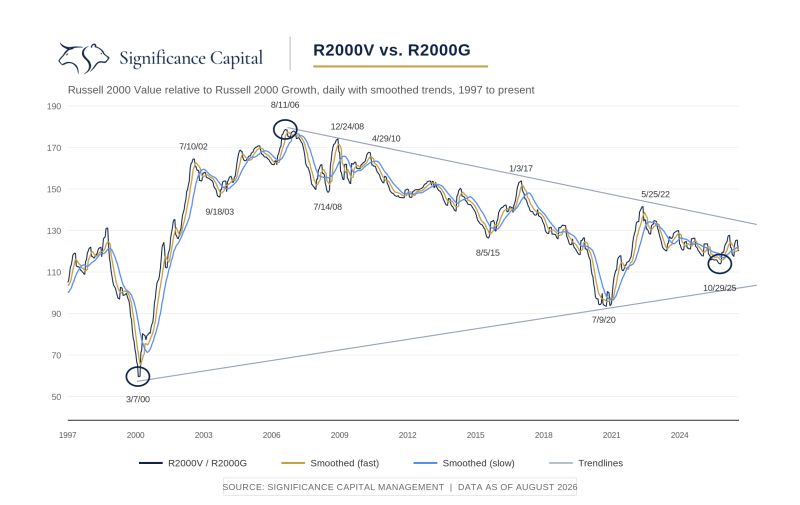
The Battle Rages On
Small- and large-cap growth-versus-value relationships turned together on October 29, 2025—only the third synchronized turn in nearly 30 years.
Read the Note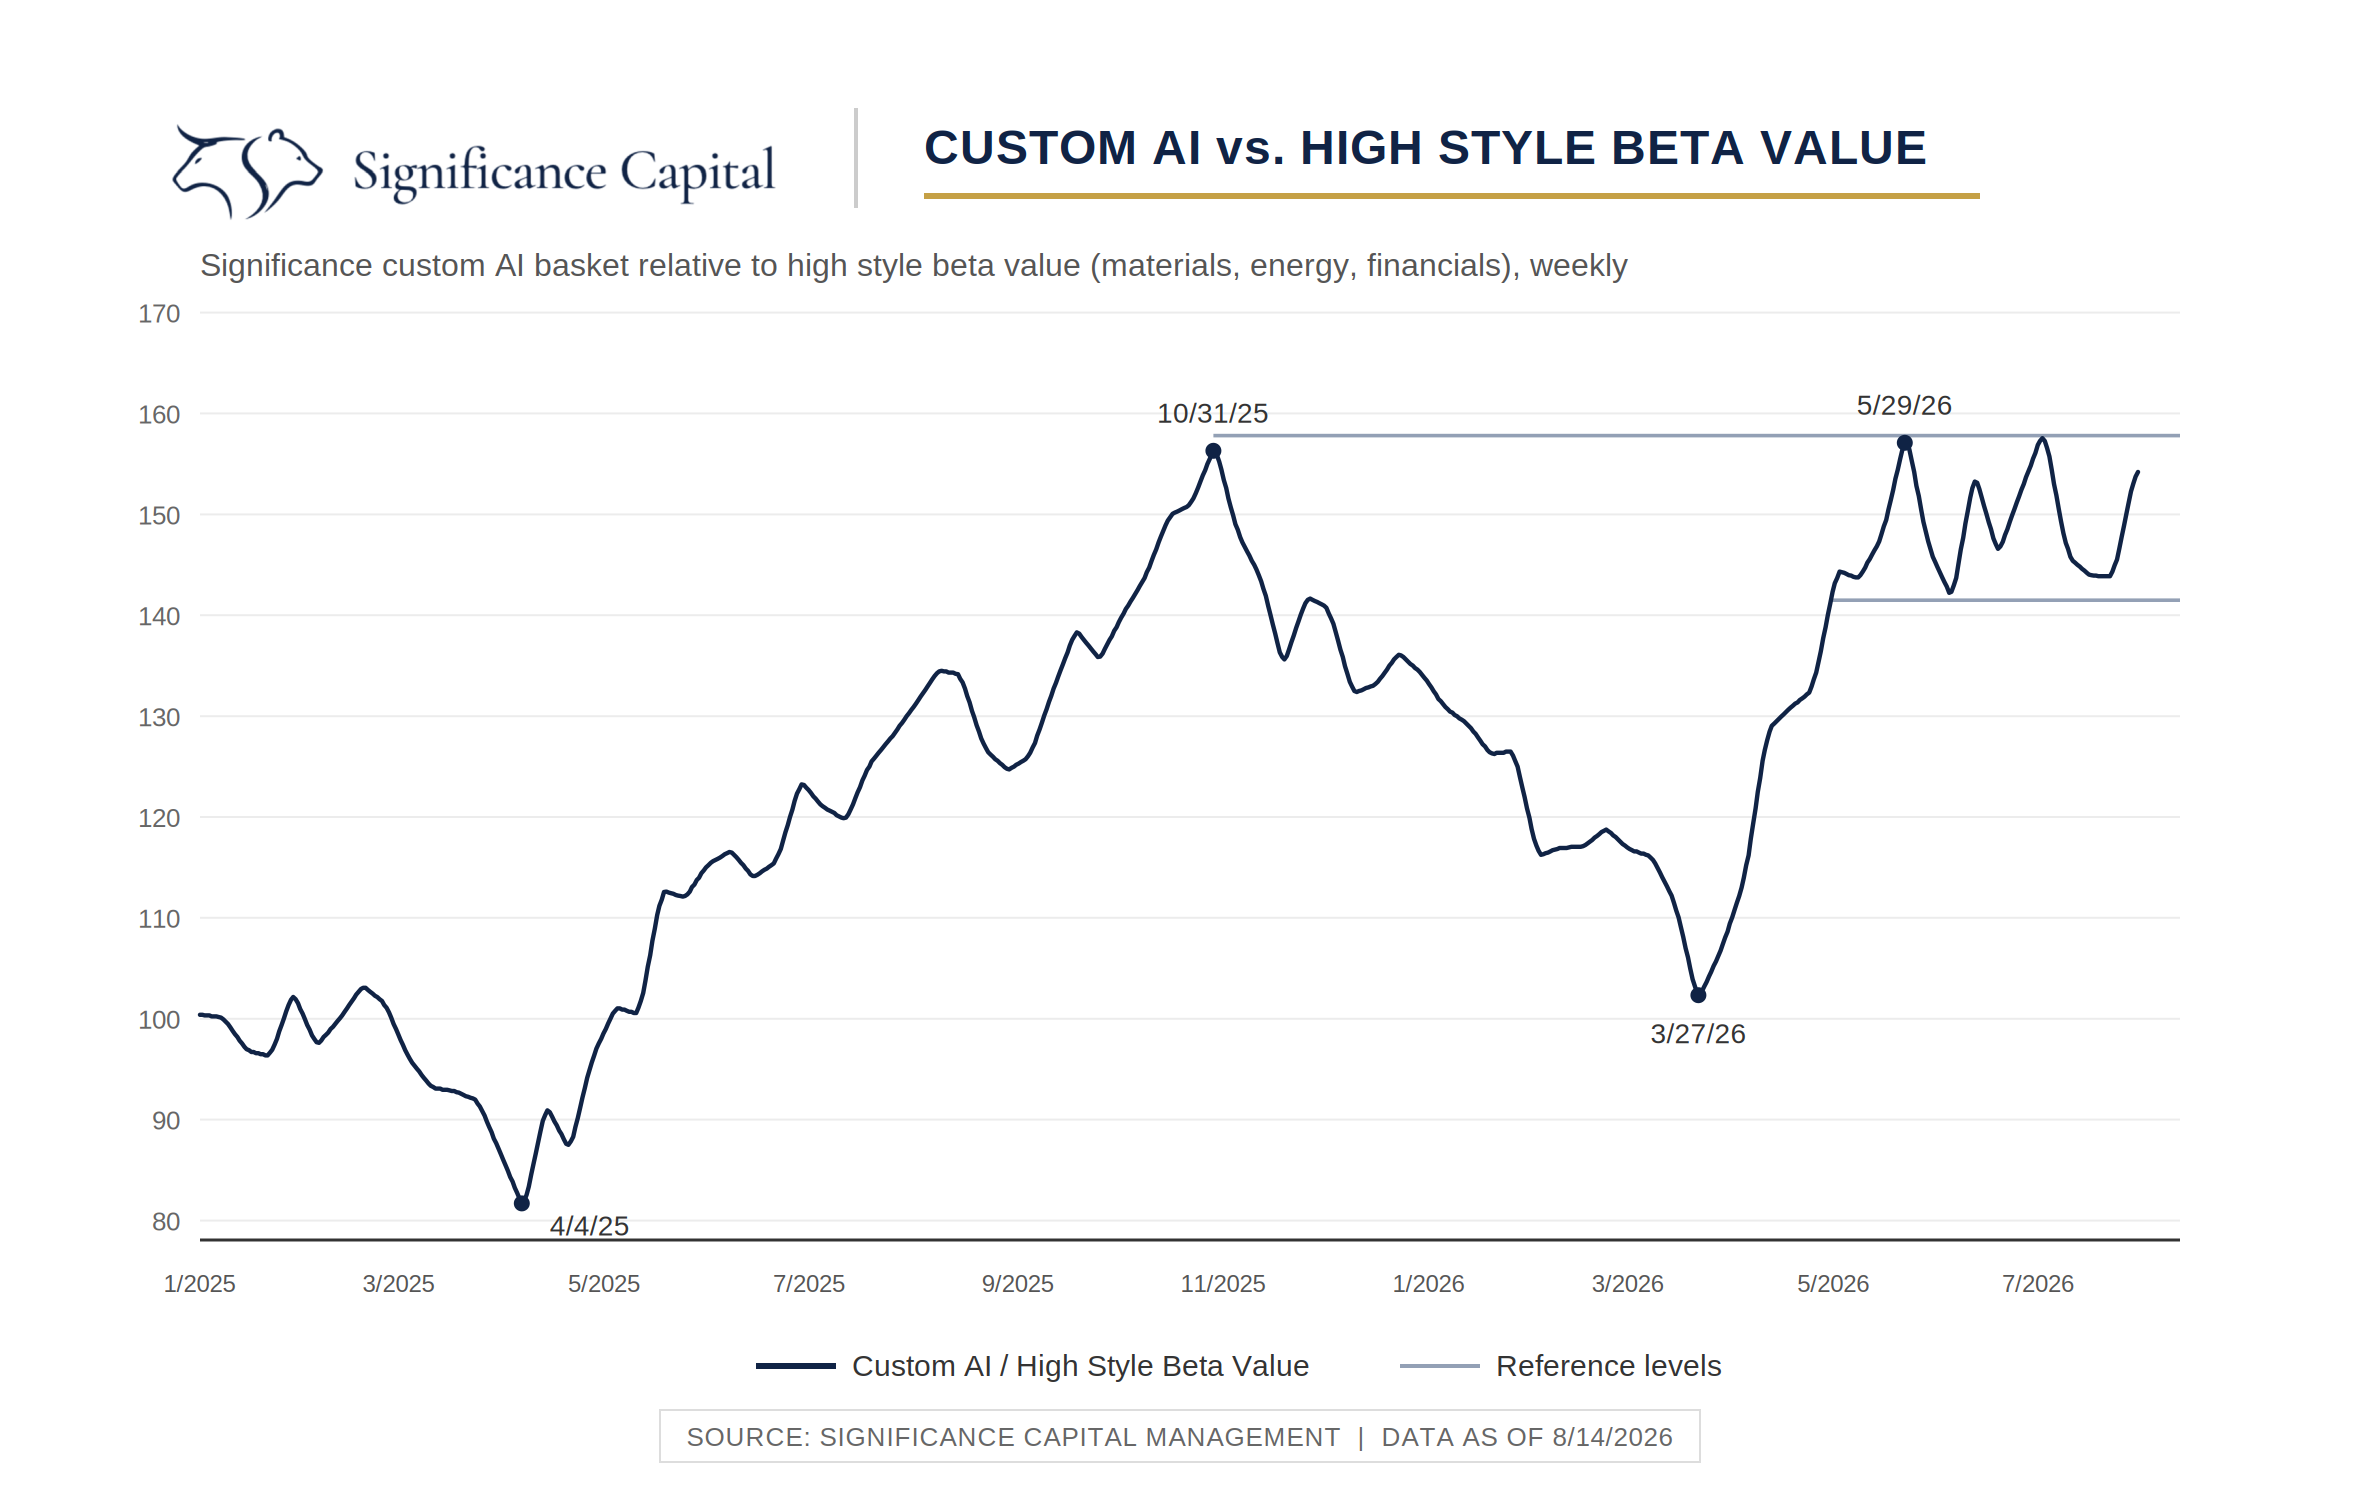
Goodbye Debbie
The market is deciding between two regimes: whether the strongest AI names keep the lead or give it up to the commodity complex.
Read the NoteA Tale of Two Tails
Our proprietary momentum indicator has declined since late June even as SPY has pressed on to new highs—a widening gap we have observed around prior market tops.
Read the Note